Kit Purchased from:

Pre-Lab Questions:
1. What is the name of the enzyme you will be studying in this series of labs?
2. Why will you use an artificial substrate instead of the natural substrate (cellobiose) during the labs? What is the name of the artificial substrate?
3. What are the two functions of the Stop Solution?
4. What is the name of the product that will be measured by the spectrophotometer?
5. Why won’t you use Diastix to measure the amount of glucose produced as a result of the enzymatic reaction?
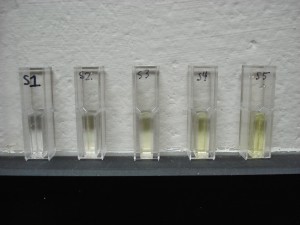
6. What is the purpose of the standards (S1-S5) in this series of labs?
7. What is the purpose of a standard curve?
8. What does it mean to “interpolate”?
9. Describe the difference between qualitative and quantitative data.
10. How will you collect qualitative data during each lab in the lab series?
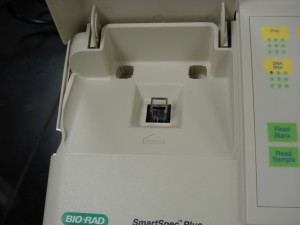
11. How will the spectrophotometer measure the amount of product? Does the spectrophotometer yield qualitative or quantitative data?
12. What is the relationship between absorbance and the amount of p-nitrophenol in a sample?
Lab 1: Determine the Reaction Rate in the Presence or Absence of an Enzyme
1. What is the purpose of the Control tube? How is it different (in composition) from the Enzyme Reaction tube?
2. Do you expect to detect p-nitrophenol in the Control tube? Enzyme Reaction tube? Why or why not?
3. In the cuvettes depicted below, the enzyme was allowed to react with the substrate for a different amount of time (E1 = 1min, E2 = 2min, E3 = 4min, E4 = 6 min, and E5 = 8 min). Based on these results, what is the relationship between time and the p-nitrophenol production?
Activity 2: Determine the Effect of Temperature on the Reaction Rate
Study the cuvettes below. The enzyme reaction took place for two minutes at three separate temperatures: 0 °C, 22 °C, and 37 °C. Considering the three temperatures tested and the results depicted in the cuvettes, what is the relationship between temperature and enzyme activity?
Activity 3: Determine the Effect of pH on Reaction Rate
Study the cuvettes below. The enzyme reaction took place for two minutes in three separate environments: pH 5.0, pH 6.3, and pH 8.6. Considering the three pHs tested and the results depicted in the cuvettes, what is the relationship between pH and enzyme activity?
Activity 4: Determine the Effect of Enzyme Concentration on the Reaction Rate
Cuvettes H1, H2, and H3 represent a reaction between the substrate and a high concentration of cellobiase compared with L1, L2, and L3 which represent using a lower concentration of enzyme with the substrate. In both sets of cuvettes, the first cuvette (H1 and L1) represents a reaction time of 1 minute, the second cuvette (H2 and L2) = 2 minutes, and the third cuvette (H3 and L3) = 8 minutes. Based on the results depicted below, does enzyme concentration impact the rate of product formation? How do you know? If both sets of reactions (H and L) were given an unlimited amount ot time to reach completion, would you expect the same or different amount of p-nitrophenol in each reaction tube?

Activity 5: Determine the Effect of Substrate Concentration on Reaction Rate
Cuvettes H1, H2, and H3 represent a reaction between celliobase and a high concentration of substrate compared with L1, L2, and L3 which represent using a lower concentration of substrate with celliobase. In both sets of cuvettes, the first cuvette (H1 and L1) represents a reaction time of 1 minute, the second cuvette (H2 and L2) = 2 minutes, and the third cuvette (H3 and L3) = 8 minutes. Based on the results depicted below, does substrate concentration impact the rate of product formation? How do you know? If both sets of reactions (H and L) were given an unlimited amount ot time to reach completion, would you expect the same or different amount of p-nitrophenol in each reaction tube?
Activity 6: Test Ability of Mushroom Extracts to Increase Reaction Rates
1. After measuring 1 gram of fresh shiitake mushroom and adding 2 mL of extraction buffer to it, why did you grind the mushroom?
2. After grinding the mushroom, you filled a microtube with slurry and centrifuged it for two minutes. Why did you use the microcentrifuge?

3. After combining the mushroom extract with the substrate, you allowed the reaction to proceed for various amounts of time (cuvette 1 = 1 min, cuvette 2 = 2 min, cuvette 3 = 4 min, cuvette 4 = 6 min, and cuvette 5 = 8 min). Study the results depicted in the cuvettes below. Did the mushroom extract contain cellobiase? How do you know? Did greater reaction time yield a greater amount of product? How do you know?
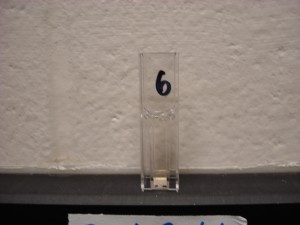
4. In this activity, you used Cuvette 6 (extraction buffer + mushroom extract) as the “blank” when calibrating the spectrophotometer whereas you used S1 (Standard 1) to blank the spectrophotometer in the first five activities. Why did you use Cuvette 6 to blank the spectrophotometer during this experiment?
5. Note the results in cuvettes 1-5 when 1 grams of DRIED shiitake mushroom was used instead of fresh shiitake mushroom. What might account for the difference in results (in terms of the shade of yellow color)?

6. Many lab groups calculated a much higher rate of product formation during this experiment compared with Activity 1. Assuming pH, temperature, and the amount of substrate remained constant, how do you account for the difference in the rate of formation between the two experiments?


